

T20 Batting Map

In the last post, I showed you this plot and said that this IPL has seen the rise of many batters that not only score quickly but also start scoring quickly earlier in the innings.
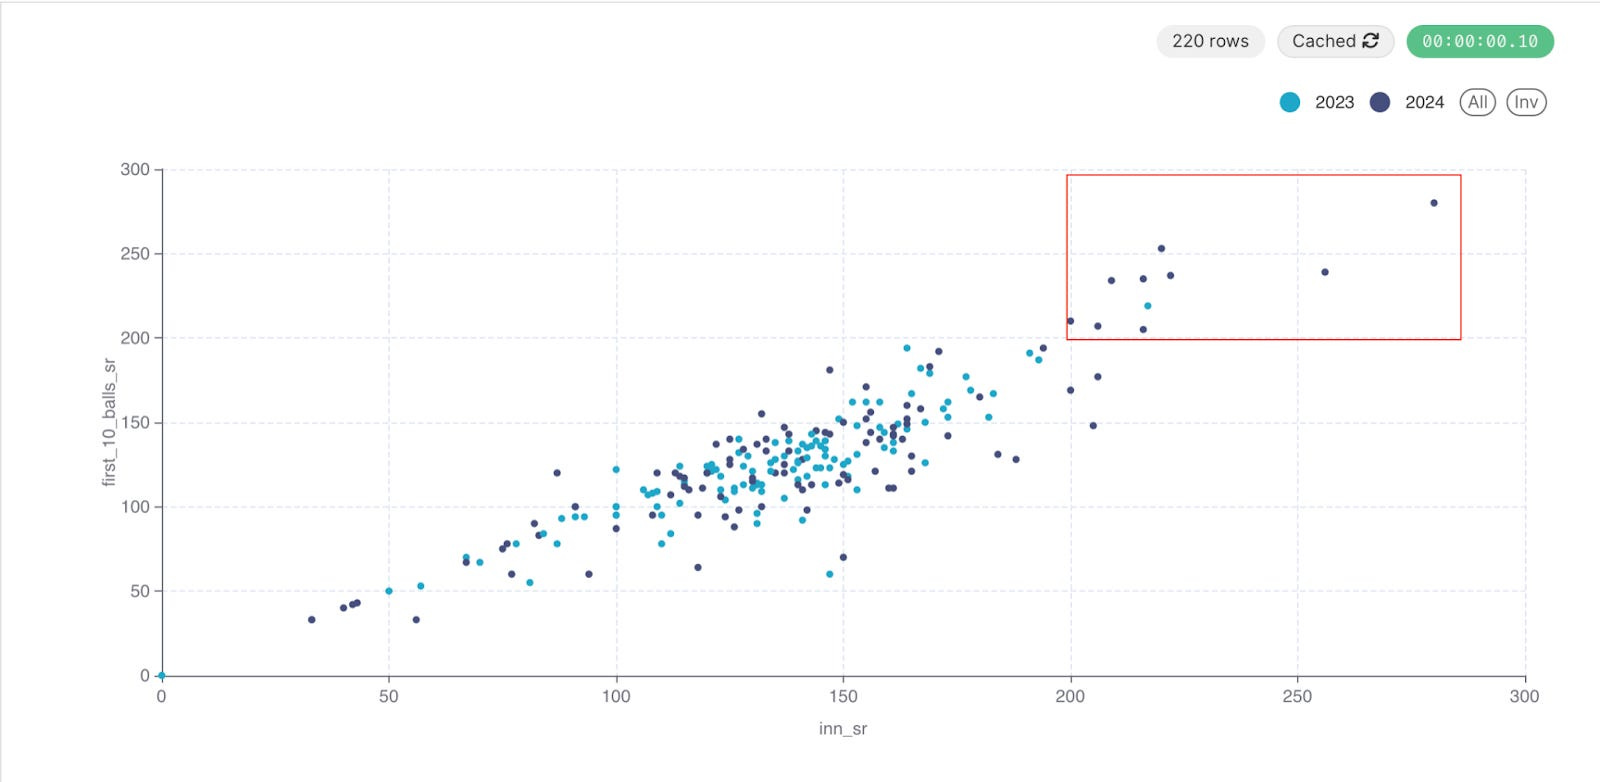
The plot signalled an inevitable doom of bowling in the T20 format. But if we see the updated plot below (data till 2nd May), the top right corner is not as dense now.
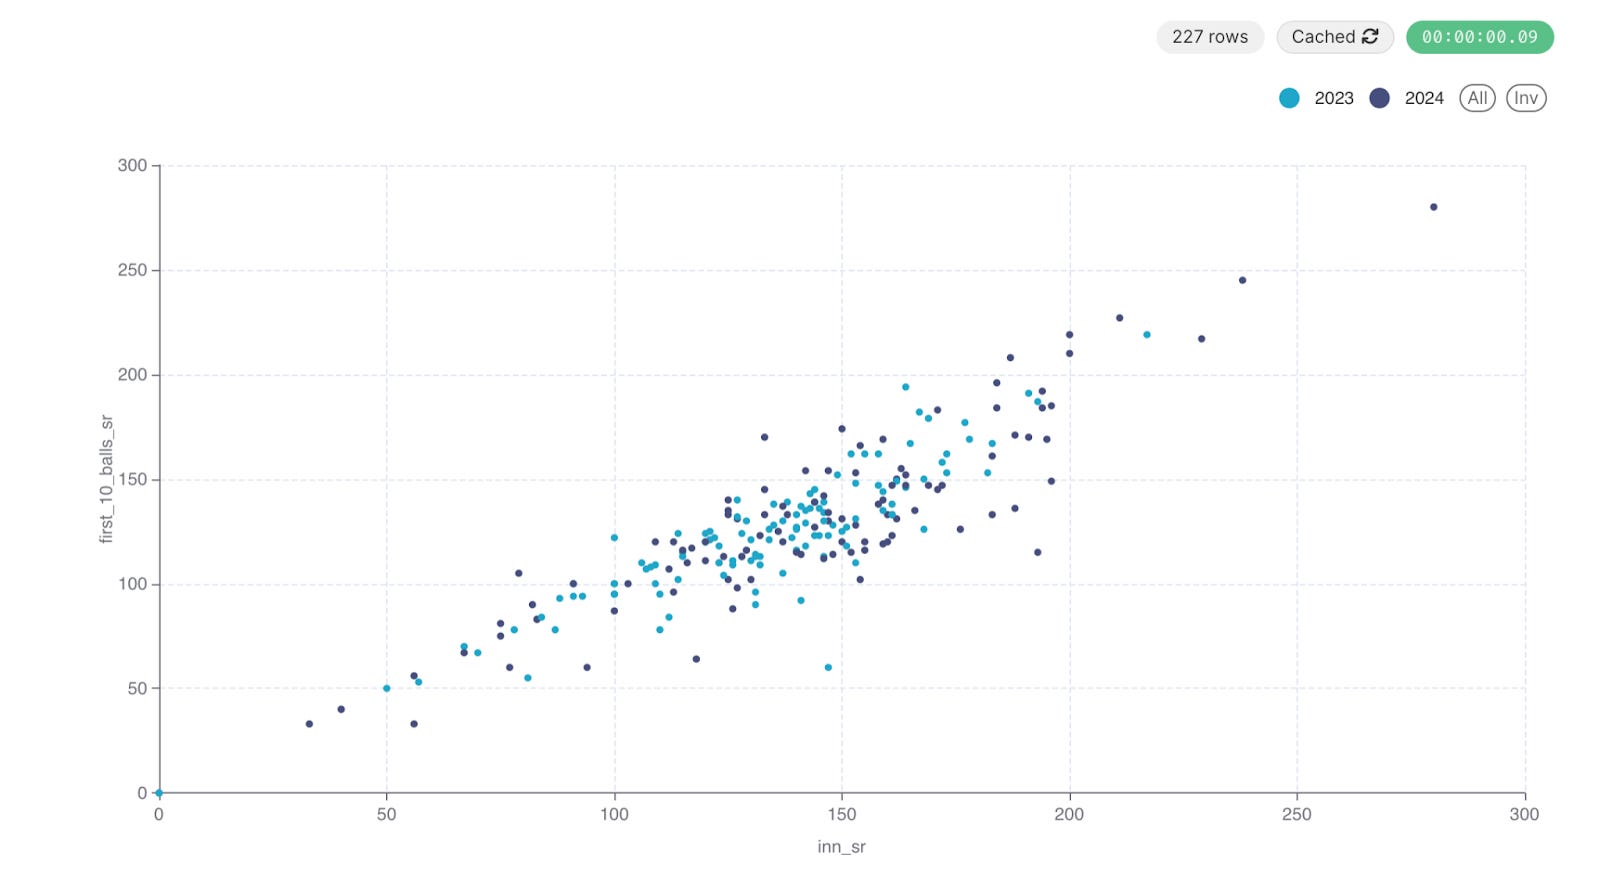
Is this the mean catching up or have the pitches become more difficult to score on? Can be both. Those of us who are watching the matches would have noticed the change in the nature of pitches. The MI vs KKR at Wankhede on 3rd May was won by KKR after scoring a meagre 170 in the first innings. Hitters like SKY and Tim David were not able to accelerate. It is the same Wankhede that has also witnessed a score of 230+ that was almost chased.
Despite the slowdown, the fact remains that batting in T20s is evolving and accumulating runs at 120 SR and hitting later to catch-up is becoming Plan B, instead of being the norm. In the same KKR match, they sent Manish Pandey (who is not a hitter but an accumulator) only when they were 4 wickets down. Till then, despite losing wickets, they kept scoring quickly.
This has been a funny IPL season. The variance in scores seems to be much higher this time. Given that T20s are played in varied conditions, it is expected to be the case. This variance makes it difficult to compare strike rates of players across matches. So, there has to be a standardised metric that takes into account the context of the match.
To solve this, I’ll use something called ‘Net Runs Per Ball’. It is defined as the delta of runs scored per ball with respect to the required runs per ball (req_rpb). For example, if the 180 runs are required on 120 balls in an innings, the req_rpb is 180/120 = 1.5. If a batter scores 30 runs in 20 balls then his net_rpb will be (30/20 - 1.5) = 0. If he scores 40 runs in 20 balls, his net_rpb will be 40/20 - 1.5 = +0.5. If he scores 20 runs in 20 balls, his net_rpb will be (20/20 - 1.5) = -0.5.
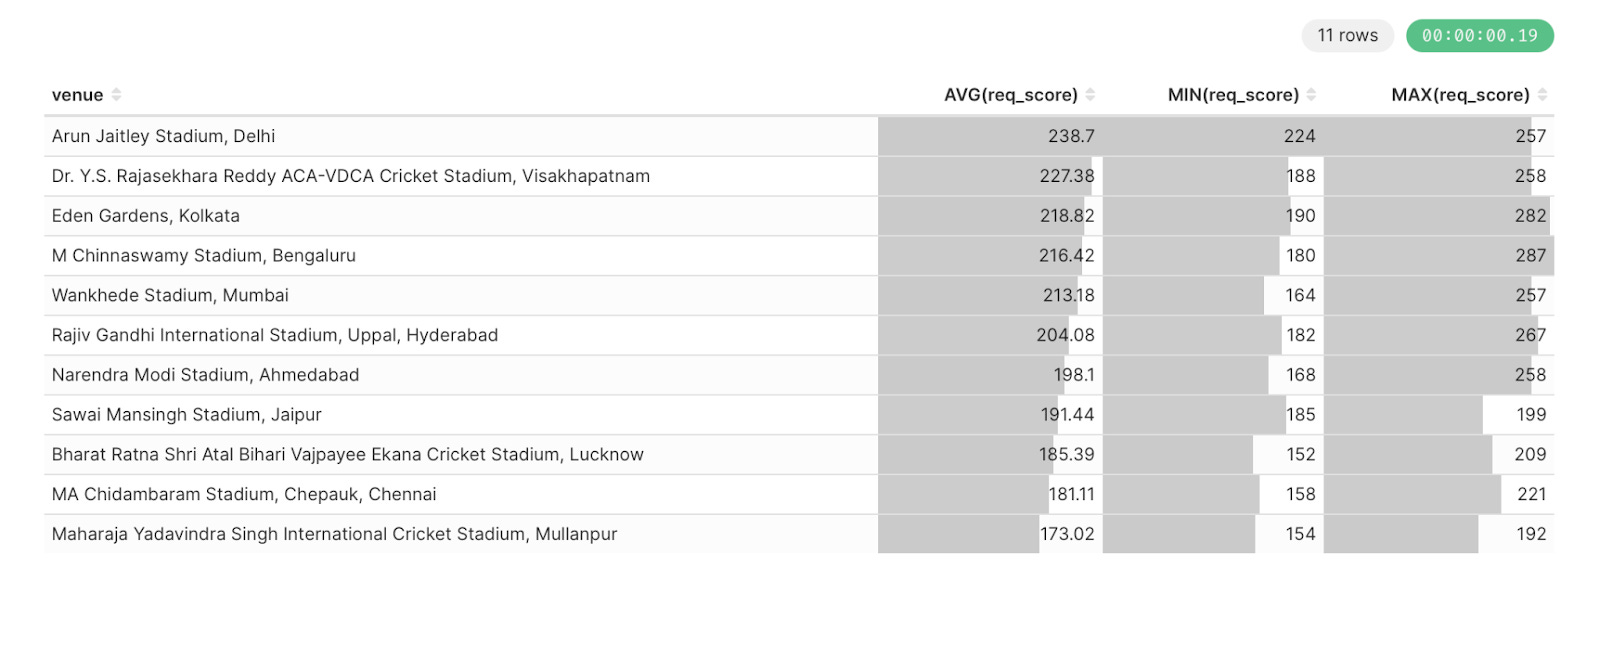
How is ‘Required Runs’ calculated? For the second innings it’s straightforward - it is one run more than what was scored in the 1st innings. For the first innings, it is complicated. I will write a separate post to explain the logic in detail. For now, please live with the definition - it is the runs that should have been scored in the first innings to have an even contest. I am sharing the average, minimum, and maximum of the first innings required runs according to my calculation (the data considered is till 2nd May) -
Keeping the required runs per ball in mind, the performance of a batter can be evaluated based on the following three metrics - how long was the innings (balls_played), how many incremental runs were added per ball in the innings (net_rpb), how early in the innings did the batter start adding the incremental runs per ball (net_sr_first10balls). For a given match, if we trace this on a bubble chart, we get a clear view of what transpired in the innings batting-wise. To demonstrate, I have taken my favourite match of this season - LSG vs CSK at Chepauk. Ruturaj scored a fabulous century but Stoinis bettered it in the second innings. The batting map of that match is this -
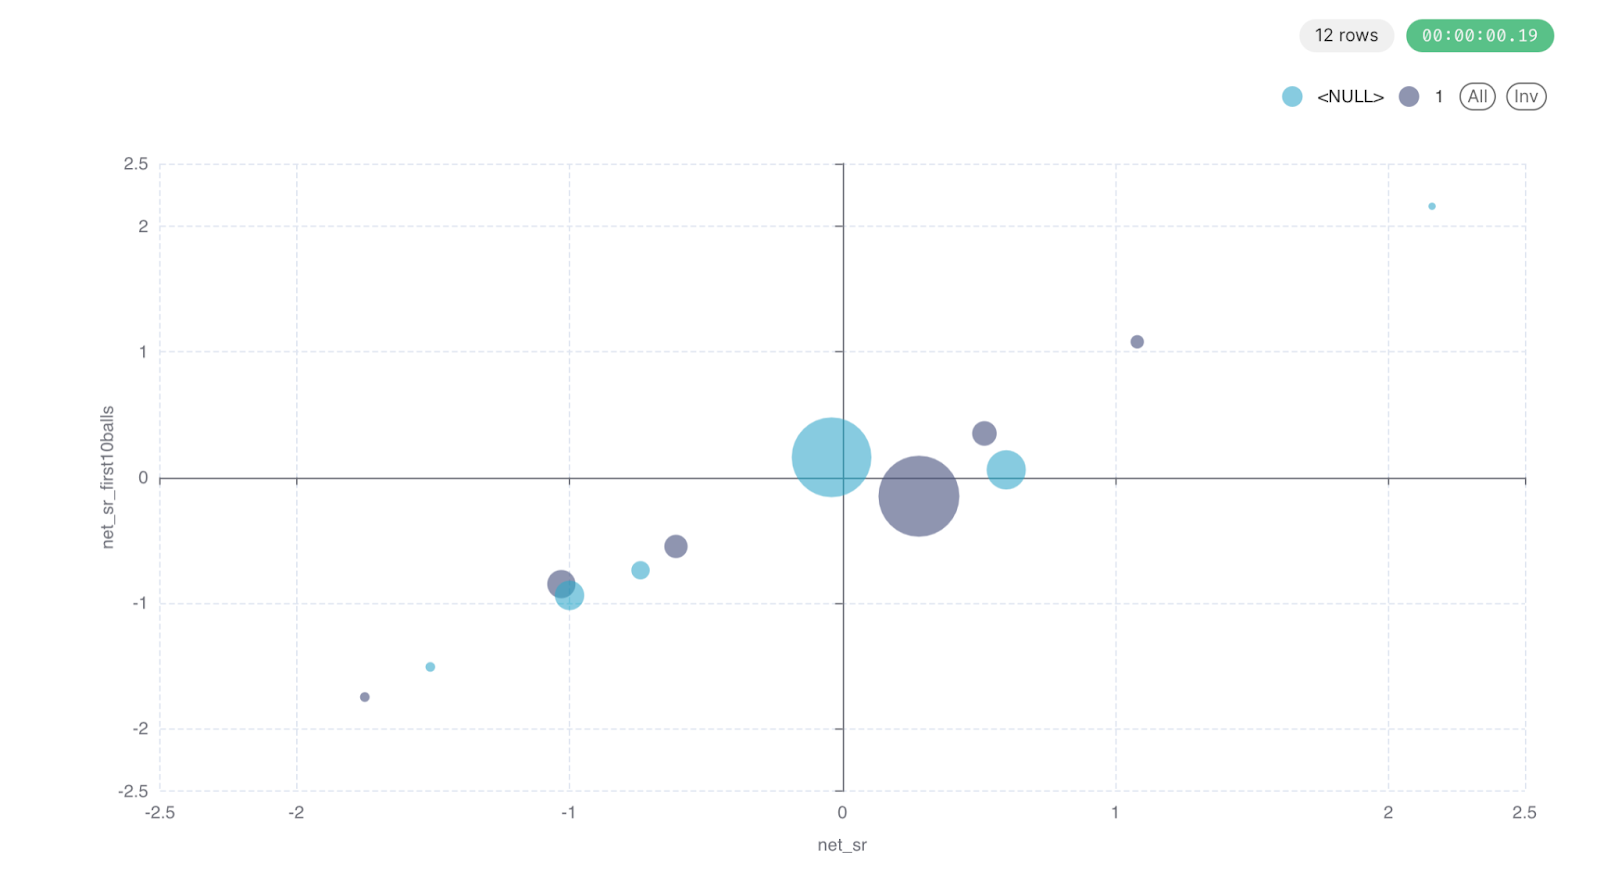
The dark blue bubbles are for LSG and the light blue ones are for CSK. Each bubble represents one batter. The size of the bubble represents the number of balls played by that batter.
First thing to note is the size of the bubble. In both the innings, there is one big bubble clubbed with smaller ones. This tells us that the innings was largely driven by a single player in both the innings. It was Stoinis vs Ruturaj head to head. The other smaller bubbles cancel each other out. So, whoever between the two scored more quickly ended up on the winning side. This basically says that the more balls you play, the more important it becomes to score quicker. In this case, Stoinis was a tad-bit quicker than Ruturaj.
Which brings me to the next thing one needs to notice on the map - the position of the bubble. The Stoinis bubble is below the x-axis which means he started slow and above the y-axis which means by the end of the innings he caught up. If we look at the Ruturaj bubble, it is slightly above the x-axis which means he started quick but he is slightly to the left of the y-axis which means he ended at less than the required runs per ball and we all know that LSG breached the Chepauk fortress in that match.
Does this mean Ruturaj played a poor innings? Not at all. His innings look marginally poor relative to how much the opposition scored which determines what the required score was. Please note that this is post-match analysis. While batting, Ruturaj would not have known if Stoinis would score quicker than him in the second innings. In the mid-innings interview, I vaguely remember Dubey saying that they had scored 10-20 runs above par. In my assessment, since the score was chased successfully, CSK had scored just about par. I will explain this in more detail in my required score calculation post.
This framework can be extended across matches to evaluate player performances, team batting approaches etc. I am hoping to cover these in the subsequent posts.
For now I will leave you with the batting map of a few more innings that I found interesting. Please use the comment box to let me know which innings you would like to see the plot for and I will respond. Meanwhile, please don’t forget to share and subscribe -
RCB vs SRH first innings (287/3) -
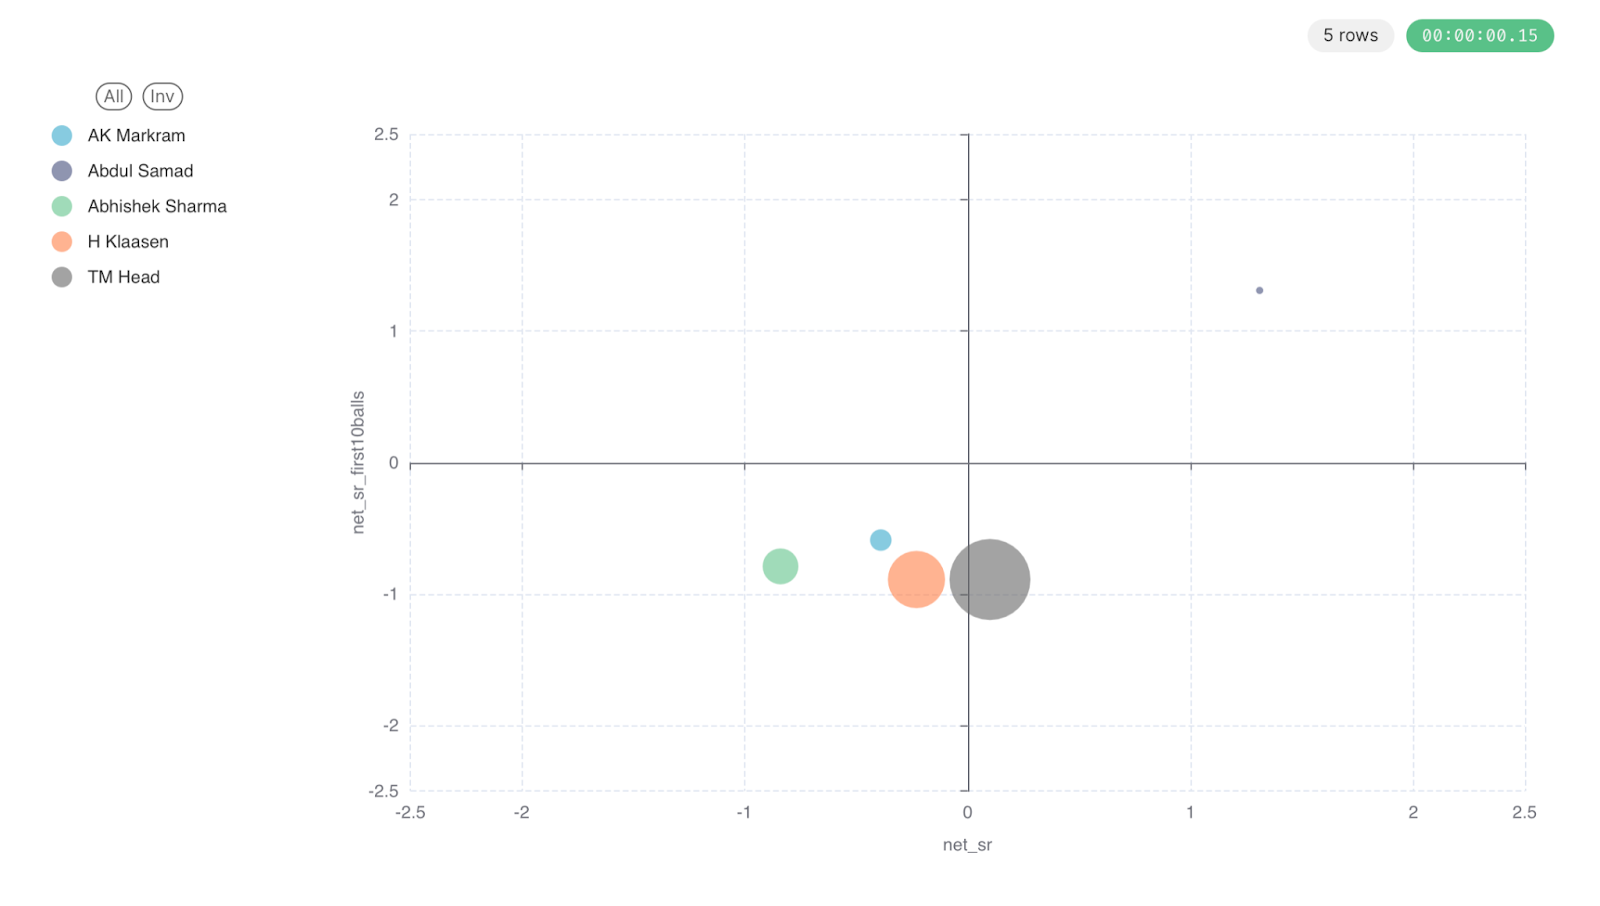
Notice the orange dot, which is Klaasen. He scored 67 runs in 31 balls. In most of the matches his net_sr would be positive but not in this crazy run-show where 287 proved to be just a little bit above the required score. Also, notice the small dot in the top right corner. It is Abdul Samad. His innings of 37 runs in 10 balls proved to be the difference eventually as is evident in the second innings graph below where RCB did not have a hitter who could come and go nuts. This is where the strike rate in the first 10 balls becomes crucial.
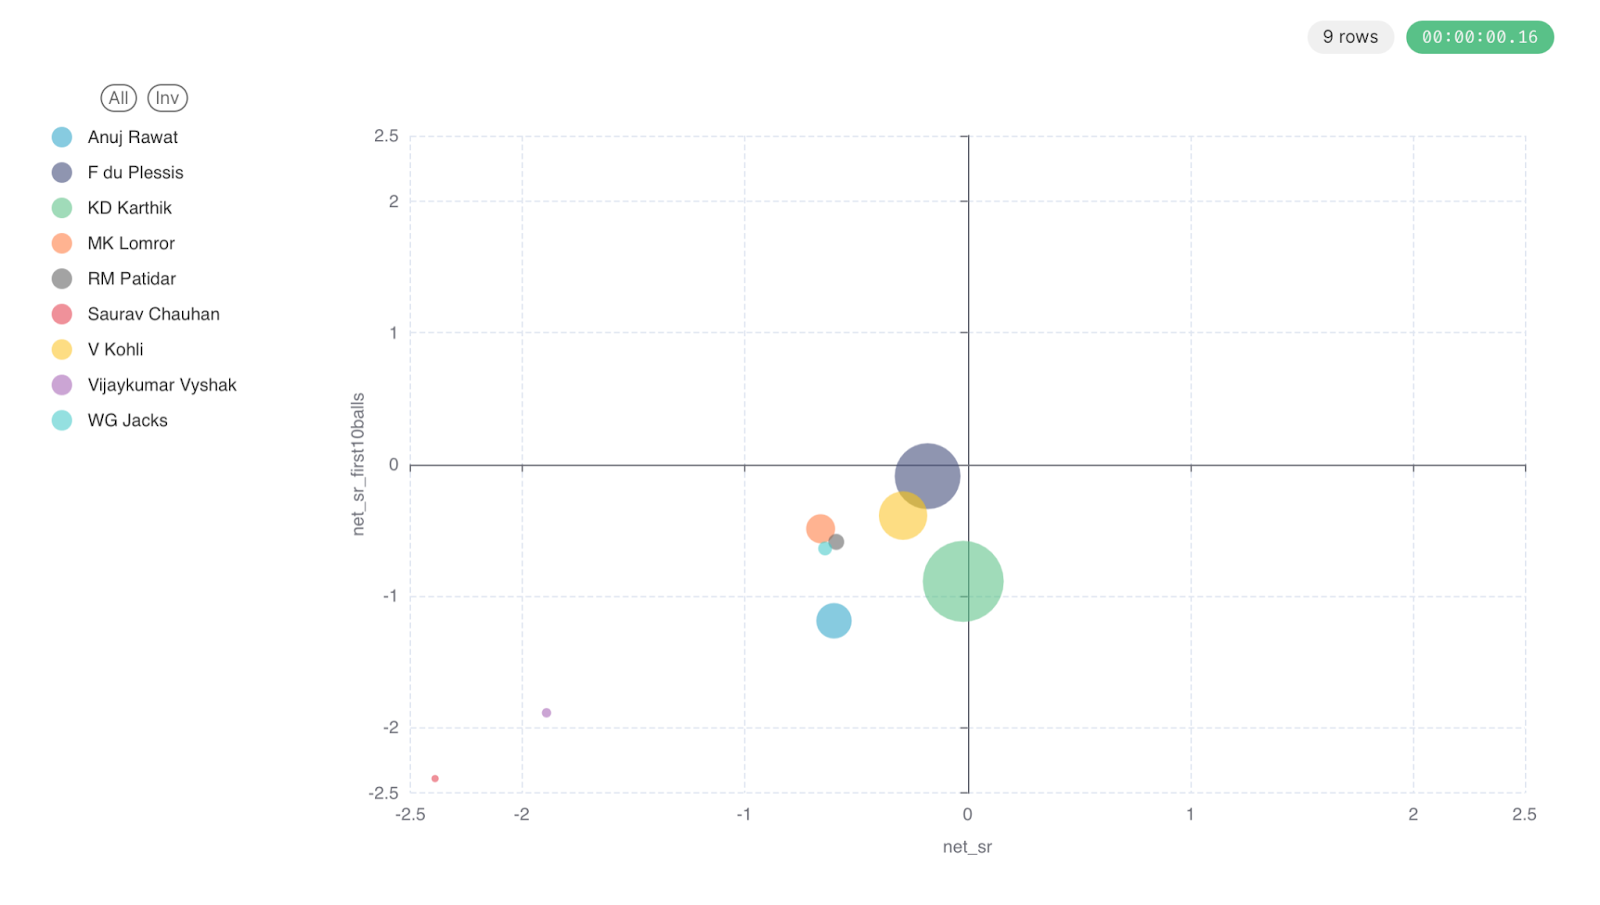
RCB vs SRH second innings (262/7) -
RR vs PBKS at Mullanpur first innings (147/8) -
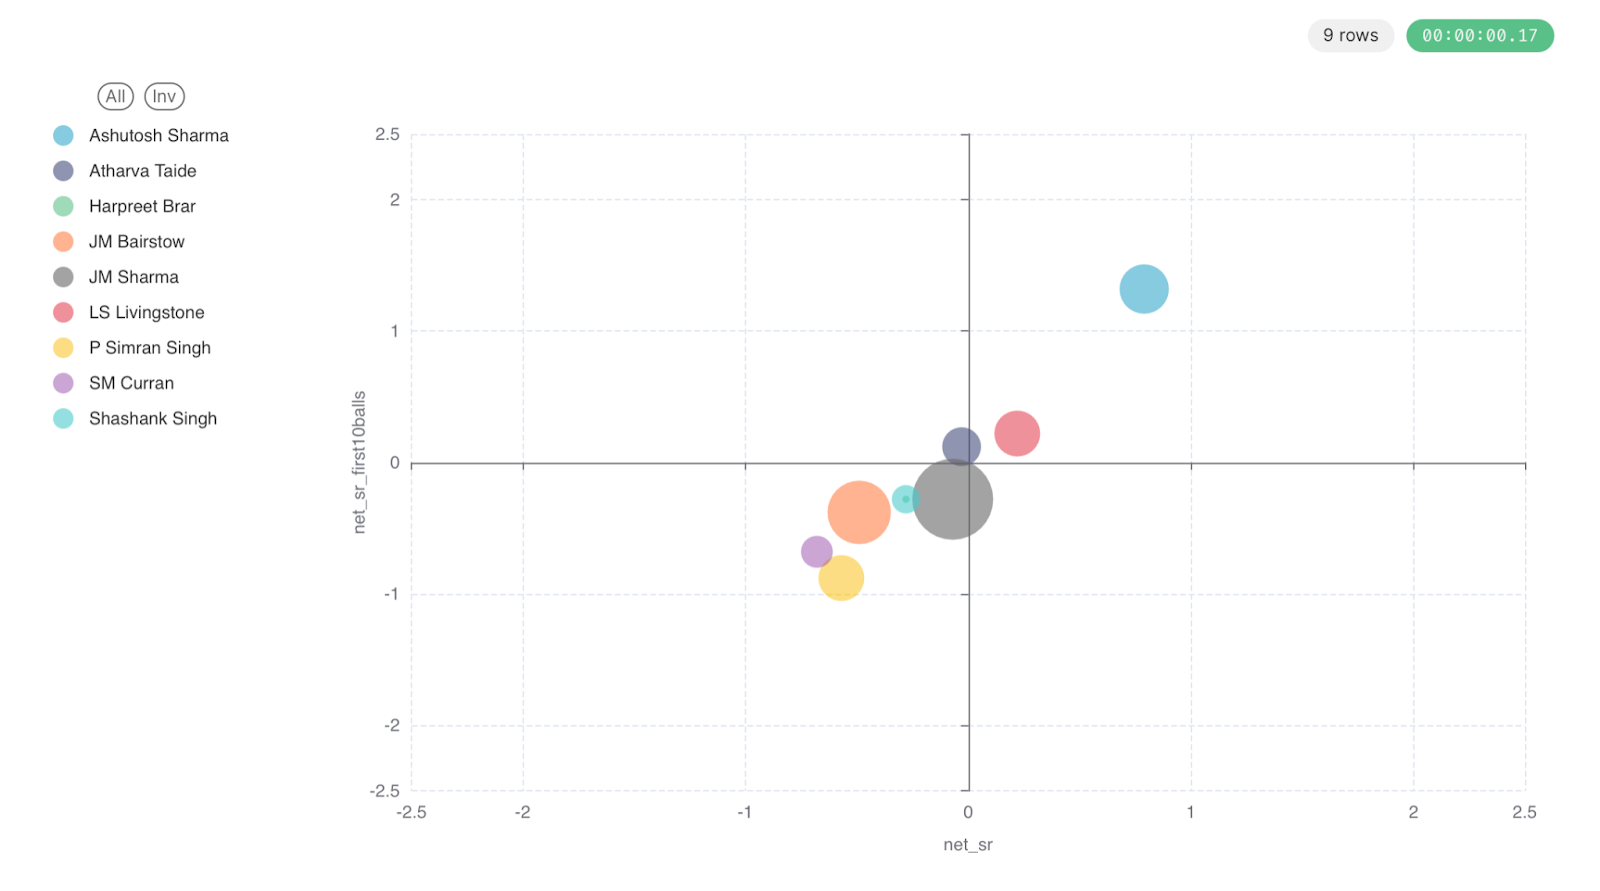
In this match, only 147 runs were scored and yet there are 2 batters with positive net_sr in the first innings - Ashutosh Sharma and Liam Livingstone. Though this score was chased successfully, it took 19.5 overs for that.
RR vs PBKS at Mullanpur second Innings (152/7) -
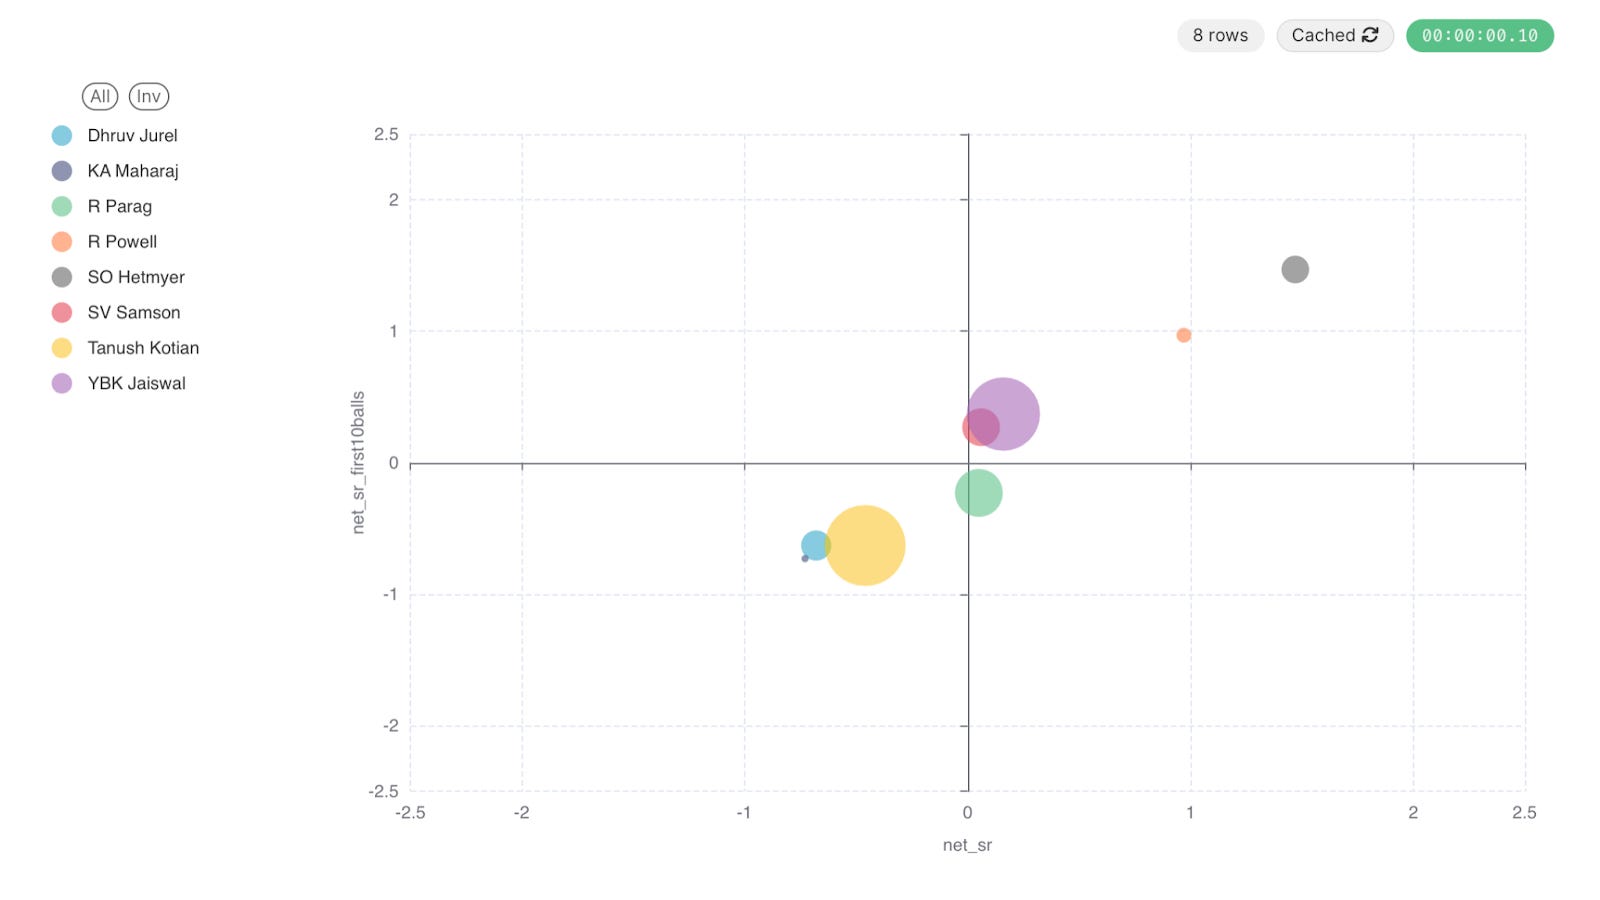
Clearly it was a complete batting performance from RR. Almost every batter contributed positively to the next strike rate and 4 of them started out well.